The Michelin Guides are a series of guide books that have been published by the French tyre company Michelin since 1904. The Guide awards up to three Michelin stars for excellence to a select few establishments. The acquisition or loss of a star can have dramatic effects on the success of a restaurant.
With this project I intend to answer the following questions:
How are the restaurants awarded with michelin stars (1, 2 or 3) distributed along the world?
What types of cuisines do they practice?
Type of project: Data Analysis, Data visualization
Topic: Gastronomy
Used tools: Python (Pandas, BeautifulSoups), SQL, Tableau
The intention was to work with a dataset which included, at least, a list of the Michelin Star restaurants, their locations and the number of stars. I tried to check if there were available datasets in Kaggle, with unsuccesfull results. Therefore, as it was not sensitive information, I decided to get the data directly by scrapping the Michelin Guide website.
First step was to access the website, filter by one, two and three stars and check the html structure of the site. From there we can observe that each restaurant ¨box¨ contains the info we are looking for (name of the restaurant, location and number of stars) and additionally it provides the type of cuisine the restaurant practices.
By pressing F12 on our keyboard we can access the dev tool with the html coding from the site. There is an alternative option which is to right click on the element we want to check from the website and then click on ¨Inspect¨ in the context menu. In the html code we can see how each element which we are interested in is coded:
Restaurant “box” (where all the info is stored): the tag is divand the class is col-md-6 col-lg-6 col-xl-3.
Restaurant name: the tag is h3.
Country: the tag is divand the class is card__menu-content–rating d-flex pl-text. Text is within the span.
City: the tag is divand the class is card__menu-footer–location flex-fill pl-text.
Stars: the tag is i and the class is fa-michelin. The stars are coded in a funny way, “m”stands for 1 star, “n”for 2 and “o”for 3.
“Cuisine: the tag is divand the class is card__menu-footer–price pl-text.
With that information we can go to pythomn and program the scrapping. For that we will need BeautifulSoupand requests.Pandasis also imported for the final part to create a datframe with the scrapped data. The scrapping process consists of two iteration steps. As there are more than 3000 restaurantes, the website has 158 pages (20 restaurants displayed per page). A string list of pages from 1 to 158 is defined so in the first iteration we will iterate through each page by appending to the url each page from the string list. In each page we will get the html text with requests and with BeautifulSoup we parse it. Then we find all the restaurant “boxes” within this html text. In the second iteration, we iterate through all the restaurants’ boxes, getting from each of them the info we need (name, country, city, stars and type of cuisine). The scrapped info is appended to empty lists which we have defined before the loops. As a final step we create a dictionary with the lists and a datframe with it, which is exported as csv for later use in SQLServer.
Data cleaning and analysis
SQLServer
The dataframe which was exported from Python is imported as a table into SQLServer in a new database which we call “michelin”. The table needs some cleaning in a few columns before working with it. For the cleaning process in each column we create a stored procedure which we could reuse in the future if we update the table:
Country column: remove “MICHELIN GUIDE “ at the beginning. With a select distinct we observe that Beijing, Hong Kong, Guangzhou, California, Taipei & Taichung, Macau, Shanghai and Seoul are in this column. We need to replace them with their corresponding countries.
Michelin stars column: we need to replace the html code for the number of stars with an integer which corresponds to the actual number: – m is 1 – n is 2 – o is 3
Cuisine column:
there are duplicates within the same row in the Cuisine column. For example
– Scandinavian, Scandinavian – Catalan, Catalan – Modern French, Modern French – etc
We will remove the part of the string which is after the comma. With CHARINDEX we find the position of the comma in the string, with SUBSTRING we select the number of characters from the starting position (1) to the position just before (-1) the character we are searching (‘,’ in our case).
Once the cleaning is done, we can create a few views and agregations. Firstly we create views of the table restricted to 1, 2 or 3 Michelin Stars. Then, we want the number of restaurants grouped by country, first all stars, then 1, 2 and 3 stars. Views are created from this. Finally, we join the results of the views to get a complete overview (we limit the shown countries to the top 10). The TOP needs to be increased from one table to the next to avoid having Nulls, as there might be countries in the top 10 of 1 Michelin Star but the same country not be in the top 10 of 2 Michelin Stars and so on. We do the same process for the City column instead of Country. Finally we do a grouping by Cuisine column, but with this one I am just interested in all the restaurants, not in each categroty of michelin stars (1, 2 and 3).
Data visualization
Tableau
From SQLServer we export as an excel the table after it is cleaned, to import it afterwards into Tableau. We create 5 worksheets which we will include in the final dashboard:
Worksheet 1. In this worksheet we use the latitude and longitude which is automatically generated by Tableau based on the Country and City columns. A map is visualized thanks to this, using the number of restaurants as main measure. A color scale is used for a nicer and clearer visualization of this.
Worksheet 2. An horizontal bar chart is created, with the number of restaurants per country.
Worksheet 3. An horizontal bar chart is created, with the number of restaurants per type of cuisine.
Worksheet 4. We just want the total number of restaurants.
Worksheet 5. I designed shapes to use as visual filters in the Dashboard. The Shapes have to be imported after placing them in the Tableau repository.
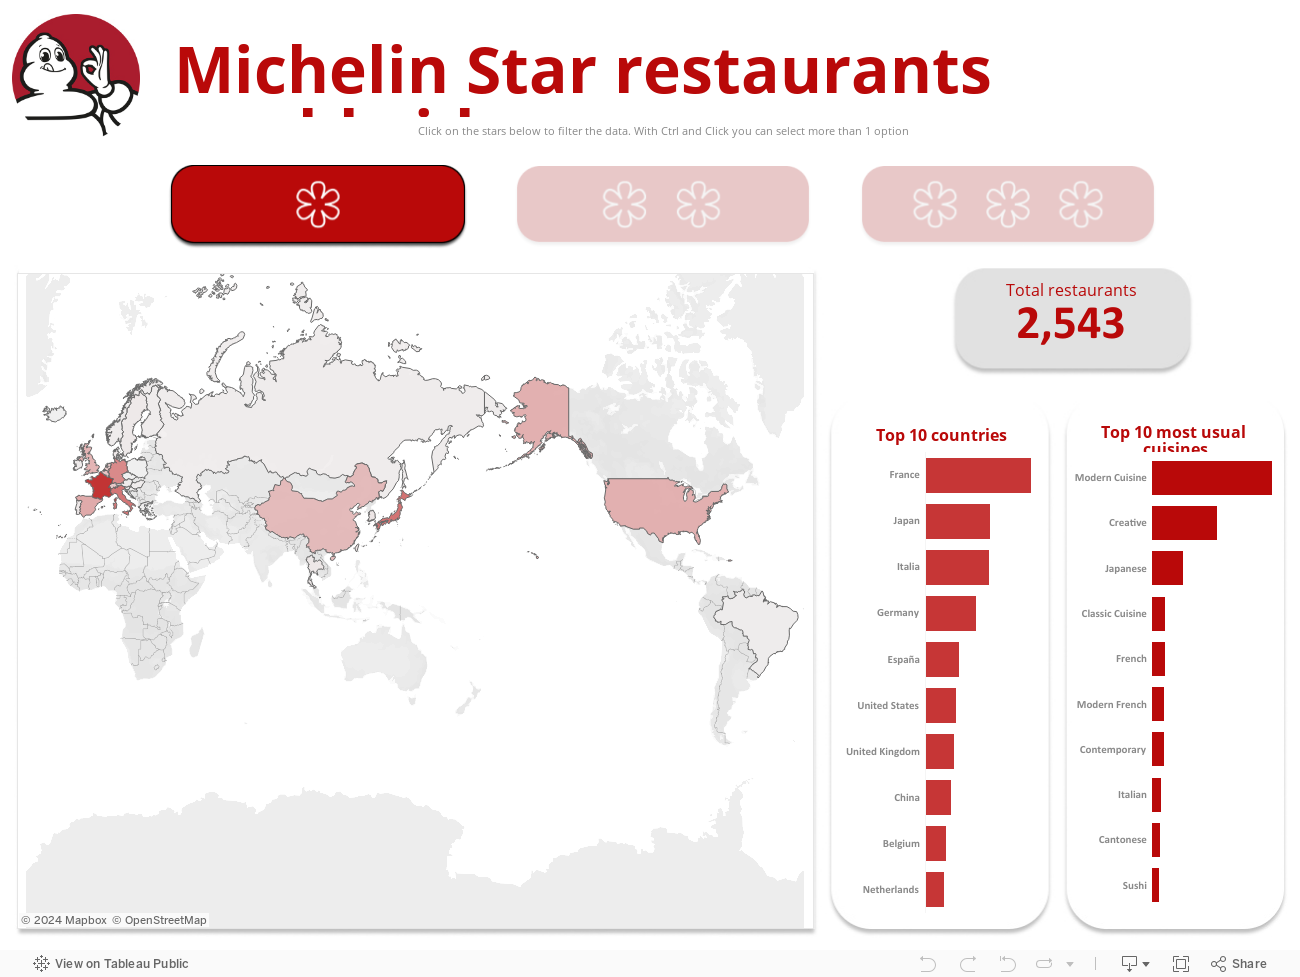
Once the worksheets are finished, we place all of them in a dashboard in the desired way. The final result can be observed below. Feel free to interact with it.
Conclusions
There are a few conclusions we can get from this analysis.
First of all, obviously, the more stars, the more reduced is the number of restaurants. It is a matter of quality, only a selected group of chefs can achieve that level in their cuisine.
For the three groups of number of stars, France is the leading nation, followed by Japan.
Creative and modern cuisines are the main streams by far. This suggests that it is complicated to achieve a star by cooking a different style.
By looking at the map it can be observed that the guide is dominated by the occidental world. Appart from Japan, which is a leading country, and a lower number of restaurants in USA and China, most of the countries in the list are European. It is surprising to not have more restaurants in the south american continent (just a few brasilians) or in Asia (for example India, with a rich gastronomy) excepting the mentioned cases of Japan and China. In Africa directly there are none. This is because to be a Michelin starred restaurant it needs to be located in a city where there is a Michelin Guide. This seems to indicate that the number of restaurants with Michelin Stars are correlated with countries wealth or income per capita.
To expand the analysis I would go in this direction, try to find patterns or correlations between countries economic parameters and their number of Michelin stars.